Quarterly Market Report - Tariff Edition
Posted:April 5, 2025
Categories:
Global markets have endured a shock to close out the week. The announcement of the United States tariffs this week has caused extreme uncertainty. The S&P 500 declined 9.1% over the past two days, marking the largest decline since March 2020. In my experience, the stock market, in particular, hates uncertainty. Combined with an overvalued stock market in the US and high leverage, the reaction on Thursday and Friday was unsurprising. Falling markets occur less frequently than rising markets, and market drawdowns are typically much more severe. For investors, this is not a time to panic. Instead, this is the time when a diversified portfolio thrives.
I have yet to discuss tariffs in great detail, mainly because the news concerning tariffs has been sporadic and unknown. It’s also a very complicated and inter-woven topic as it relates to the macroeconomic strategy being undertaken by the Trump administration. Firstly, for better or worse, this topic has become increasingly politicized. I will do my best to steer clear of politics and instead focus on the markets. I will also do my best to discuss the basic economics of trade and tariffs and then examine each market to understand how this may impact stocks, bonds, gold, and other assets.
Before I discuss markets in detail, the reasons for their negative reaction, and the impact of tariffs on the global economy and markets, I’d like to provide some historical context regarding trade and tariffs. History can help us understand what is occurring today, especially since a United States President hasn’t employed this strategy to this extent since World War I.
Historical Review of Trade
Michael Pettis and Matthew Klein, authors of Trade Wars are Class Wars, argue that, by definition, all economic output is either consumed or used for investment. However, some countries produce more than they use, while others produce less. The differences are reconciled through trade, which creates surpluses and deficits for all countries (Pettis & Klein, 2020, pp.66-67). They further argue that countries will choose either a high-savings or high-wage model. Historically, countries have relied on a combination of the two for growth.
- High Savings Model: A development strategy where a society prioritizes investment in productive capacity over immediate consumption. This model aims to fuel economic growth by channeling resources away from household spending towards government and business investment in infrastructure and capital goods.
Examples of this model include Great Britain in the 18th century, the Soviet Union under Stalin during the interwar period, Japan after World War II, and China since the early 1990s. In general, this model transfers savings and resources from consumers to the government, particularly to an economy's industrial and manufacturing sectors. As we’ll see in this report, China has abused this model during much of the 21st century, which is a primary reason for today's events.
- High-Wage Model: The high-wage model is a development strategy that prioritizes high wages and rising worker living standards. It aims to fuel economic growth through robust domestic demand and attract foreign capital.
Examples include the North in the United States in the 19th century and Britain in the 18th century, as they combined the high-wage and high-savings models. The high-wage model emphasizes the importance of well-compensated workers in driving strong domestic demand and attracting foreign capital to fuel investment and economic expansion. In today’s economy, the United States is not using this model. Instead, Pettis argues that the US has been playing the role of the "world's indispensable spender," absorbing excess output and savings from countries with high savings rates driven by income inequality (Pettis & Klein, 2020, p. 174).
Trade in the 21st Century
For most of the 21st century, the United States has faced a trade disadvantage. Many countries have employed strategies that have harmed the United States in trade, most notably through currency manipulation, levying tariffs on our exports, and other practices such as stealing intellectual property. Since 1944, the US dollar has been the dominant global reserve currency, and U.S. Treasury bonds have thus become the main reserve asset countries hold to facilitate global trade. The world needs dollars, and the US dollar underlies the entire global economy in our current debt-based monetary system.
Since President Richard Nixon ended the convertibility of the US dollar to gold in 1971, all currencies have freely floated against one another. As the 1970s unfolded, oil shocks further exacerbated inflation, leading to the creation of the Petrodollar system. In this system, the United States agreed with Saudi Arabia to price oil in US dollars, thereby creating a demand for dollars and US Treasury bonds (Daunton, 2023, p. 567). With the US holding the mantle of the global reserve currency issuer, we were tasked with providing the world with the liquidity of the world reserve asset, primarily through the US dollar and US Treasury securities. This has led to significant trade imbalances, with the United States consistently running trade deficits and countries like China consistently running trade surpluses. As a result, this has eroded our industrial base, hollowed out the middle class, and overvalued the dollar, making US exports more expensive.
Since the 1990s, China has employed the high-savings method to prioritize a manufacturing and investment-driven economy, systematically transferring savings and spending power from ordinary Chinese households to subsidize domestic investment and foreign consumption. (Pettis & Klein, 2020, p.108). China has achieved this through an undervalued currency, financial repression via very low interest rates on deposits, state-run allocation of cheap credit to manufacturers, labor cost suppression, land expropriation, and capital controls. Early in this process, this economic strategy lifted all boats as Chinese citizens' standard of living increased and China’s economy boomed. However, the obsession with achieving ever-higher GDP growth led this model to prioritize unproductive projects with debt, especially after the 2008 financial crisis. This resulted in a massive surge of Chinese goods sent worldwide, particularly to the United States. This also resulted in a financial disaster in China, characterized by high debt levels and unproductive projects, which China is currently addressing. For the United States, the result was a rise in imports and a trade deficit, deindustrialization, job losses in the manufacturing sector, a decline in the middle class, an increase in household debt, pressure on wages, and other significant economic and social impacts.
The Trump administration attempts to reverse this trade policy by directly onshoring manufacturing. They want the United States economy and GDP (income) to have a higher share coming from the manufacturing sector rather than being led by consumption. They also want the US to have the ability to manufacture the critical goods needed in the event of geopolitical tensions as a matter of national security. However, this shift will take time and cooperation with our trading partners. In other words, if this is what the United States wants, China must shift its economic model towards growth led more by consumption rather than their investment-driven model. From a cultural perspective, this is a significant and challenging change that will likely take years to implement. The current administration also acknowledges that the United States faces a substantial financial and debt challenge. The United States is nearing the end of its long-term debt cycle. We can’t print money to pay interest, leading to financial ruin. The current administration is implementing several policies to help our country begin to dig out of its enormous debt burden. This is a tall task, but not impossible.
Tariffs are a completely normal way to attempt to reshape global trade. This is just one strategy among many that can be used. However, the use of tariffs is relatively unfamiliar to Americans, and it’s a tool that has been used to a limited extent since the Great Depression. See Figure 1 below, courtesy of Bianco Research, which estimates that the new tariff rate is now upwards of 22%, the highest since 1909. Notice the red line that goes vertical on the right side of the chart. The main issue is that the strategic details of tariffs can change at any moment. No one knows how this will turn out. This fact alone may be the reason the stock market sold off sharply. The world is starting to price in a trade war.
Figure 1: Average Tariff Rates on U.S. Imports, 1909-2024
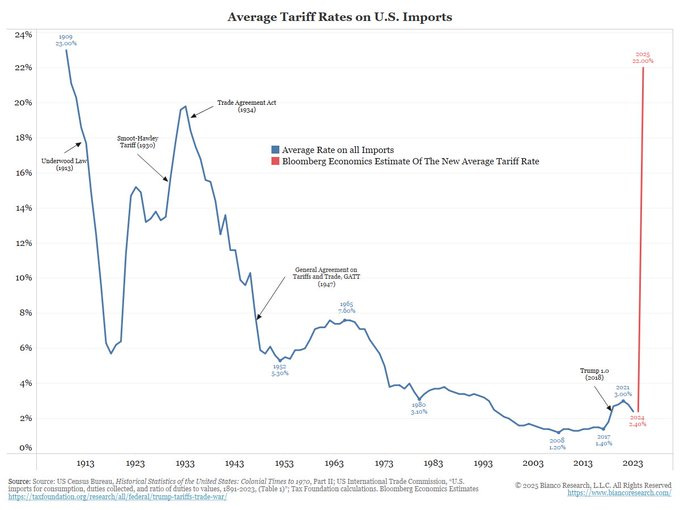
Source: Bianco Research
Stock Market Impact
The stock market was already down on the year coming into the tariff announcement. This further exacerbated the downside, a normal occurrence in the market's history. Markets never go up or down in a straight line. Simply stated, tariffs are a tax on corporations. Now that the market sees the certainty of tariffs, it creates uncertainty as to how companies will choose to react to them. Companies can choose to eat the import tariff costs, which would hurt their bottom line and negatively affect the market. Companies could also increase prices, possibly leading to higher price inflation and even the big “R” word: a recession. If the tariffs are implemented, companies are likely to increase costs, which will negatively impact consumers. In turn, this is expected to hurt the economy. Furthermore, a lower stock market inevitably results in lower consumption due to the wealth effect. Thus, thinking that the economy is immune to the effects of tariffs is a bit naive. However, some short-term stock market and economic pain might just be what the doctor ordered in the long run. This is the current bet and plan for the Trump administration.
The betting markets are now pointing to a greater than 50% chance of a recession in 2025. The authors of The Rise of Carry argue that instead of the stock market reflecting or signaling an impending economic recession, the S&P 500 is the recession.
“The S&P 500 itself has become central to the global carry regime, and a stock market crash is not just a signal of recession—it is the recession” (Lee, Lee, Coldiron, 2020, p.6).
Drawdowns & Balanced Portfolios
Drawdowns in equity markets are normal. A maximum drawdown is the decline in the value of a single investment or an investment portfolio from its highest point to its lowest point. It is the maximum observed loss from a portfolio's peak to trough before a new peak is attained.
Let’s take a step back and review some data to ease the minds of any investors worried about current market conditions. Consider the following three portfolios:
- A portfolio with 100% in stocks.
- The classic 60% stocks/40% bonds.
- A 60/40 portfolio includes 60% stocks, 15% bonds, 10% cash, and 15% gold.
The table below shows each portfolio's risk, returns, and drawdowns. As expected, the all-stock portfolio had the highest returns but the highest risk, measured by its standard deviation and the most significant drawdown of 51%. The two balanced portfolios returned over 9% annually in nominal terms and 5% after inflation, with lower volatility and downside risk.
Table 1: Risk & Return, 1972 to 2025
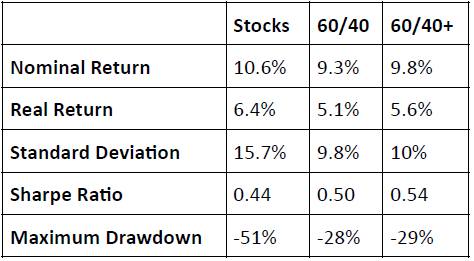
Source: Portfolio Visualizer
The figure below shows the drawdowns for each portfolio. The blue is the all-stock portfolio, while the dark and green are balanced portfolios. Diversification works for those willing to endure the good and bad markets over the long run. For both balanced portfolios, the rolling returns over 7, 10, and 15-year periods were positive. Even stocks registered positive rolling returns for 15 years. Where do we stand regarding the current drawdown following the market’s close on Friday? The stock market has experienced a 17% drawdown from February 19, 2025, to the market’s close on Friday. The 60/40 portfolio has experienced a 7% drawdown. This suggests that a further downside may be possible. However, markets are very unpredictable in the short run, so it’s impossible to predict what will happen over the coming months.
Figure 2: Drawdowns
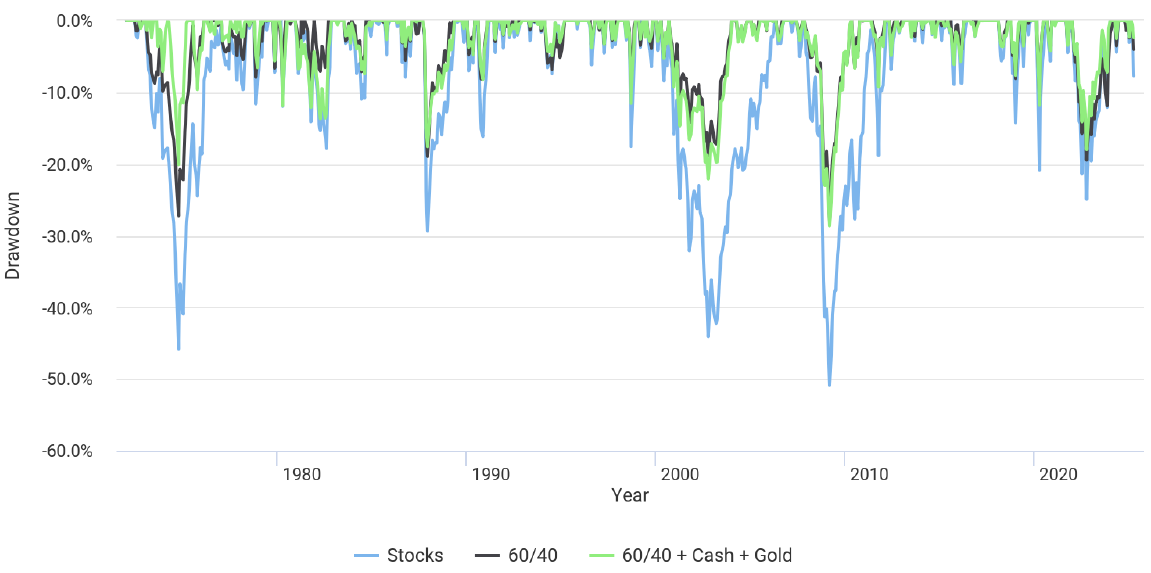
Source: Portfolio Visualizer
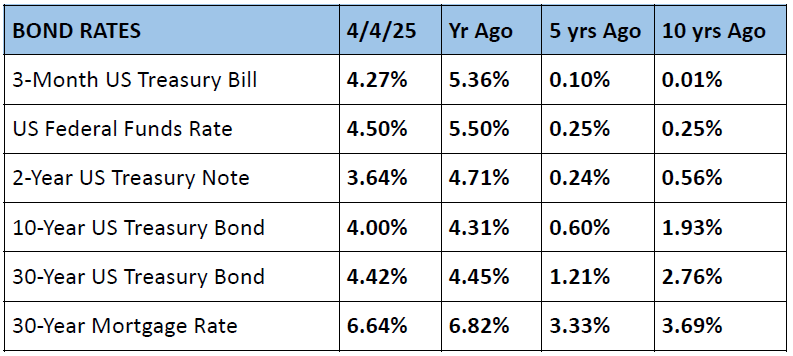
Bonds & Central Bank Rates
A primary goal of the Trump administration is to lower interest rates. Specifically, they want to lower the 10-year US Treasury rate. In terms of refinancing some $9 trillion in debt coming due this year, this would be a welcome development. The Pavlovian response this week was lower Treasury yields, with the 10-year ending the week at exactly 4%. The 2-year is headed towards the 3.5% level, indicating that the market believes the Federal Reserve will cut short-term interest rates more aggressively than it thought before the tariffs were announced. According to the CME Group’s FedWatch tool, the market is now pricing a 70% probability of an interest rate cut by the Federal Reserve in May. Looking further, there is a 37% chance that interest rates will hit 3.5% in December, representing three cuts from today’s level. Globally, most markets are pricing similar interest rate cuts, as seen in the chart below.
Figure 3: Central Bank Rate Expectations
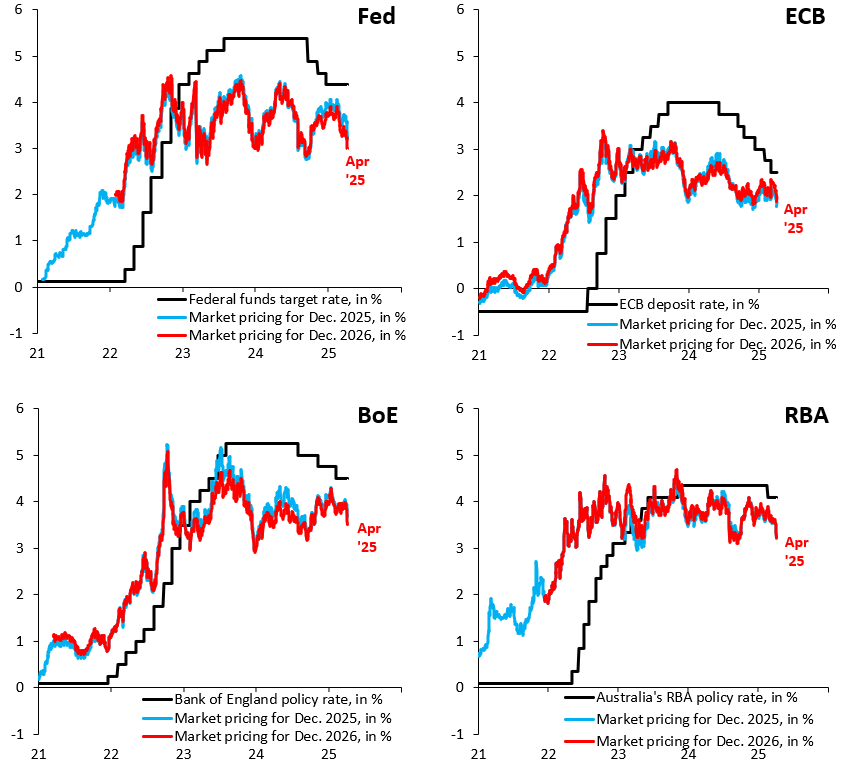
Source: Robin Brooks
Gold & Commodities
Gold continues to trounce every other asset on the planet. As normal, gold sold off along with stocks this week. However, it shed roughly 3%, while stocks in the United States shed 9%. Gold continues to receive bids from various sources, including central banks, Chinese consumers, and other entities seeking protection in a diversified portfolio through its ability to hedge against price and monetary inflation, currency debasement, and geopolitical uncertainties. In the background, we’re witnessing a shift from US Treasury bonds as the main store of value and primary reserve asset globally to a mix of US Treasuries and gold. This is not happening all at once, but gradually. Central bank stockpiling of gold has increased since the US imposed sanctions on Russia’s foreign reserves. However, the dollar remains dominant in global trade and as a reserve asset. In other commodity markets, silver sold off sharply, and oil prices followed suit, due to pressures and uncertainties surrounding future global economic growth.
US Dollar
Interestingly, the US dollar's initial response on Thursday was to sell off relative to its peers. This reversed itself on Friday, as the US dollar index rose 1%. While Trump wants a “strong dollar,” I’ve argued in past articles that a lower dollar helps risk assets and global liquidity. A weak dollar will also help our manufacturing base through the pricing power of exports. As the trade and tariff situation continues, this will be a key market to follow.
Conclusion
The world may be gearing up for a trade war. If so, this has been long in the making with historical precedent. Some short-term pain may be beneficial in the long run. The tactics, strategy, and outcome are wildly unpredictable. Can this start a large-scale credit crisis? As we live in the age of debt and leverage, it's possible. However, this could also turn around and create better and fairer trade. No one knows. Investors should be patient. Volatility in the markets is normal. Focus on your long-term goals and planning. Zoom out. Remember that a diversified portfolio provides ballast in shifting economic environments, uncertain geopolitical times, and market selloffs. Any significant and continued selloff will provide opportunities for rebalancing and taking advantage of asset markets on sale.
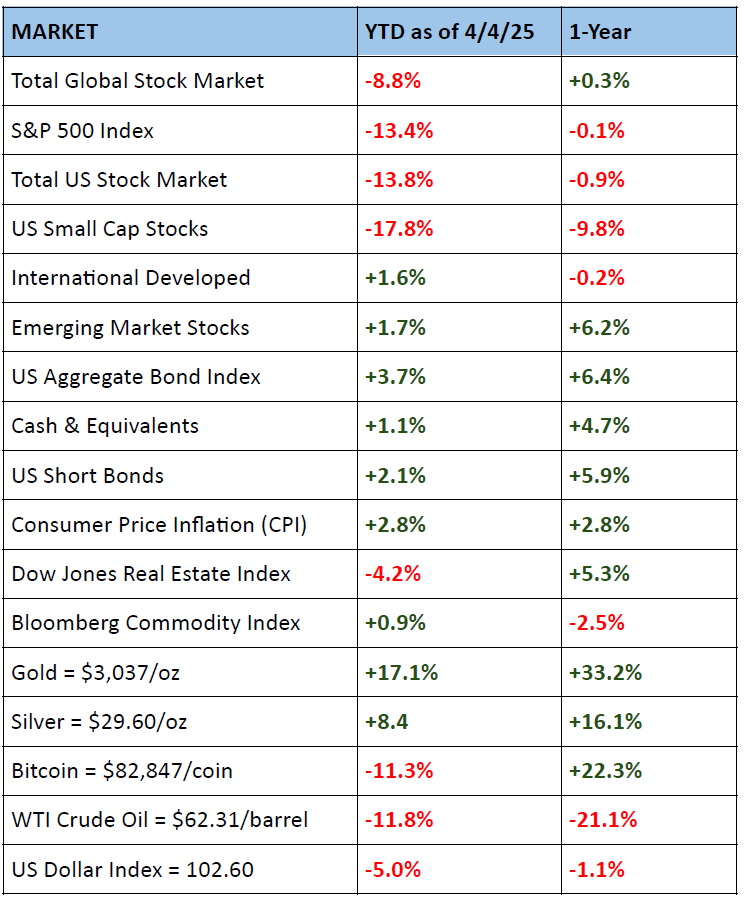
Quarterly Data
The data below are as of the end of market close Friday, 4/4/2025.
Quotes of the Month
“America has the exorbitant privilege of being able to finance its deficits by issuing its own currency, which the rest of the world is obliged to accept” Charles de Gaulle (former French President, 1965)
"The dollar is our currency, but it’s your problem." John Connally (U.S. Treasury Secretary, 1971, to G10 finance ministers)
References
- Klein, M. C., & Pettis, M. (2020). Trade Wars Are Class Wars: How Rising Inequality Distorts the Global Economy and Threatens International Peace. Yale University Press.
- Lee, T., Lee, J., & Coldiron, K. (2020). The Rise of Carry, The Dangerous Consequences of Volatility Suppression and the New Financial Order of Decaying Growth and Recurring Crisis. McGraw-Hill Education.
- Daunton, M. (2023). The Economic Government of the World: 1933-2023. Farrar, Straus and Giroux.
- Group, C. M. E. (2025). FedWatch Tool. https://www.cmegroup.com/markets/interest-rates/cme-fedwatch-tool.html
- Bianco Research
- Robin Brooks
- TradingView
- Kwanti, Inc.
- Morningstar, Inc.
- Portfolio Visualizer
DISCLOSURES & INDEX DESCRIPTIONS