Quarterly Market Report - Q4 2024
Posted:October 3, 2024
Categories: Asset Allocation, Bond Market, Bull Markets, Carry Trade, Fiat Currency, Gold, Markets, Quarterly Commentary, Stock Market

Stocks endured increased volatility during the third quarter of 2024 led by international markets. Markets fell hard early in the quarter as the Japanese Yen carry trade unwinding causing an air pocket of liquidity for leveraged investors. This trade has a long history and has “unwound” several times, to reappear. Very low interest rates in Japan continue to facilitate this speculative trade. The Volatility Index (VIX), a measure of expected volatility on the S&P 500 index, spiked to levels not seen since March 2020. Losses on stocks were reversed in a mere matter of weeks as the bull market carried on. Meanwhile, at the end of the quarter, the Chinese government announced several interest rate cuts and a fiscal stimulus as a first step to avert their deflationary economy. This caused the Chinese stock market to rip higher at the end of the third quarter. The MSCI Emerging Markets index returned 8.7% this quarter joining the rest of the world with double-digit gains in 2024. For the year, global stocks are higher by 19%.
The investment environment remains relatively good for stocks. Economic growth looks sluggish, but a recession in the United States is not guaranteed. Meanwhile, central banks have begun cutting interest rates in combination with fiscal deficit spending and lower bond volatility. These actions add liquidity to the financial system. As new cash enters the economy, some of this will inevitably find its way into the stock market. The chart below shows a 15-year history of global stocks (blue line) along with U.S. M2 money supply (green line).
Figure 1: Vanguard Total World Stock ETF (VT) / U.S. M2 Money Supply - 15-Yr

Source: TradingView
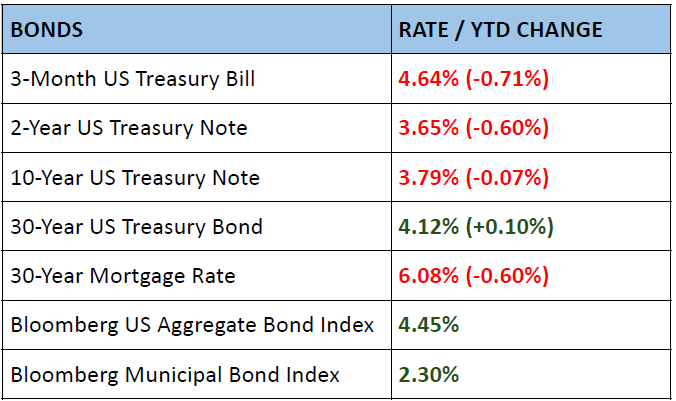
Interest rates dropped across the U.S. Treasury curve this quarter in anticipation of the Federal Reserve lowering short-term interest rates. The 2-year U.S. Treasury dropped over a full percentage point from 4.75% to 3.65%. This is common as the bond market looks to the future and “prices in” rate cuts. Interestingly, long-term U.S. Treasury rates increased after the Fed announced a 0.50% rate cut this month. Predicting the patch of interest rates over the short term is a fool's errand.
However, we can look forward to where the Federal Reserve desires inflation and the Federal Funds rate and infer longer rates assuming a normal sloping yield curve:
- The Fed has an inflation target of 2%.
- Inflation has been rather “sticky” so let’s assume inflation is 2.5%.
- Add 0.5% to get a potential 3% Federal Funds Rate.
- Add another 0.5% and you get a long-run 2-year rate of 3.5%.
- Add 1% to get a potential long-run 10-year treasury rate of 4.5%.
The current 2-year is already in the ballpark of 3.5%. The 10-year is below the potential long-run rate at 3.8%. A higher 10-year rate post-rate cut makes sense in this context.
Zooming out, it’s hard to see long-term U.S. Treasury rates going back toward the 1% handle. An outright deflationary shock could prove me wrong. I’ve shared the chart below from DoubleLine Capital as it’s one of my favorite charts on the long-end of the bond market. The great bond bull market since the early 1980s looks to be reversing course. This doesn’t mean interest rates will reverse course all at once. It’s much more like a “supertanker” changing course. There will be ups and downs along the way. But higher bond yields are more likely over the very long term than lower given the fiscal position of the United States coupled with the sheer amount of bond issuance coming down the pike.
Figure 2: U.S. Rates: 30-Year U.S. Treasury Yield
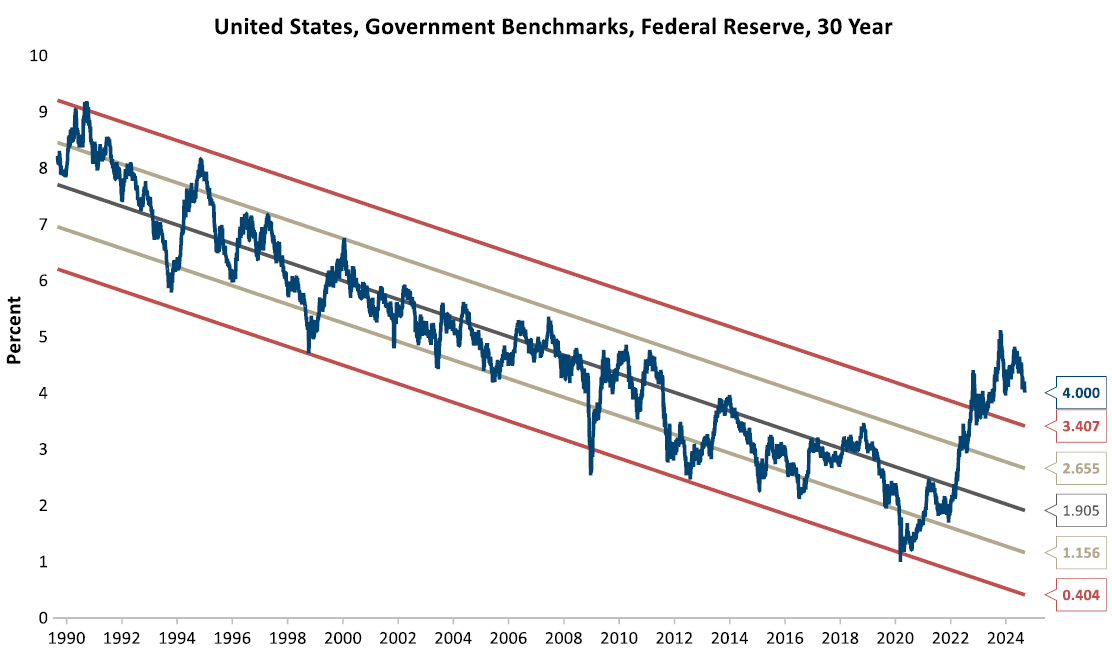
Source: DoubleLine Capital
Figure 3: U.S. Treasury Yield Curve

Source: GuruFocus

Commodities as a whole are up 1.7% on the year. Real estate had a nice quarter and is now up 14% for the year. Gold had its best quarter since 2020 rising 13% hitting an all-time high vs. the U.S. dollar at $2,685. From a technical perspective, gold looks overbought over the near term. However, looking at the long term, one can find many reasons to be bullish about gold. First and foremost, gold tends to be a great hedge against monetary inflation. Monetary inflation is the credit and debt creation by governments and/or commercial banks. Said another way, gold goes up as any fiat currency gets debased. Since 1971, governments have taken advantage and routinely increased the money supply at rates close to 8% per year. With high debt levels and the need to continually roll over existing debt, it’s hard to see this stopping anytime soon. Central banks in the East have also been stockpiling gold looking for ways to diversify their savings (see Figure 4). Certainly, gold has underperformed over periods and does not pay interest or dividends. There is no free lunch in financial markets. However, gold does provide a unique ability to diversify portfolios in the long term.
Figure 4: Central Bank Net Gold Import (Tonnes)

Source: Money Metals

US M2 money supply rose this year to $21.17 trillion. M2 consists of currency (dollars) in circulation in physical form or bank reserves, checking accounts, savings deposits, small-denomination time deposits (CDs), and money market funds. Essentially, short-term liquid cash either physical or digital. Consumer price inflation remains sticky at around 3.2%. US debt continues to rise hitting $35 trillion. Global liquidity is also rising, now at $175 trillion.
Quote of the Month
“The stock market has that magic power that makes people concerned about the county’s economic policy…once the will of the people is awakened, they will not sleep again.” Wu’er Kaixi, 1997
References
- Board of Governors of the Federal Reserve System (US), M2 [M2SL], retrieved from FRED, Federal Reserve Bank of St. Louis; https://fred.stlouisfed.org/series/M2SL, October 1, 2024.
- U.S. Treasury Yield Curve. (2024). [Dataset] https://www.gurufocus.com/yield_curve.php
- World - M2 Money Supply of Major Central Banks. (2024). [Dataset]. MacroMicro. https://en.macromicro.me/charts/3439/major-bank-m2-comparsion
- Public debt of the United States. (2024). [Dataset]. Statista. https://www.statista.com/statistics/273294/public-debt-of-the-united-states-by-month/
- Chancellor, E. (2000). Devil Take The Hindmost Plume.
- Nieuwenhuijs, J. (2024b, September 23). Nations in the mBridge Project Are Stockpiling Gold, Driving Up Prices. Money Metals. Retrieved October 1, 2024, from https://www.moneymetals.com/news/2024/09/23/nations-in-the-mbridge-project-are-stockpiling-gold-driving-up-prices-003485
- TradingView
- Kwanti, Inc.
- Morningstar, Inc.
- CrossBorder Capital
- DoubleLine Capital
- U.S. Department of Treasury
- U.S. Federal Reserve
- People’s Bank of China
- European Central Bank
- Bank of Japan
- Bank of England
DISCLOSURES & INDEX DESCRIPTIONS
For disclosures and index definitions please click here.
Opinions expressed herein are solely those of Genesis Wealth Planning, LLC unless otherwise specifically cited. Material presented is believed to be from reliable sources and no representations are made by our firm as to another parties’ informational accuracy or completeness. Written content is for information purposes only. Past performance is no guarantee of future results. Diversification does not assure profit or protect against a loss in a declining market. While we have gathered this information from sources believed to be reliable, we cannot guarantee the accuracy of the information provided. The views, opinions, and forecasts expressed in this commentary are as of the date indicated, are subject to change at any time, are not a guarantee of future results, do not represent or offer of any particular security, strategy, or investment, and should not be considered investment advice. Investors should consider the investment objectives, risks, and expenses of a mutual fund or exchange-traded fund carefully before investing. Furthermore, the investor should make an independent assessment of the legal, regulatory, tax, credit, and accounting and determine, together with their professional advisers if any of the investments mentioned herein are suitable to their personal goals. All indexes are unmanaged and an individual cannot invest directly in an index. Index returns do not reflect fees or expenses. To receive a copy of Genesis Wealth Planning ADV Part II which contains additional disclosures, proxy voting policies, and privacy policy, please contact us. Certified Financial Planner Board of Standards Inc. owns the certification marks CFP®, CERTIFIED FINANCIAL PLANNER™ and federally registered in the U.S., which it awards to individuals who successfully complete CFP Board's initial and ongoing certification requirements.