Quarterly Market Report - Q3 2024
Posted:July 11, 2024
Categories: Quarterly Commentary, Bonds, Cash, Commodities, Currencies, Economy, Interest Rates, Stocks

Stocks increased in the first half of 2024 with the MSCI All Cap World Index advancing 11.3%. The United States continues leading the world with the S&P 500 rising 15.3% this year. Lower volatility in stocks and bonds and increased global liquidity have been catalysts for stocks. A pullback in the second half of 2024 would not be surprising given recent technical data. The stock market rarely goes up in a straight line. Further, the use of leverage has increased. A strong US dollar and weak economic growth from China have hampered emerging market stocks with the index trailing the United States.
The chart below shows that American ownership in the stock market is at all-time highs at 34.5% of household net worth. Two factors have been at play here since the lows near the early 1980s. First, the “Great Moderation” started in the early 80s ushering in a 40-year-long stretch of low volatility, falling interest rates, and rising stock prices. Second, the 401(k) plan was created in 1978 allowing Americans an easy, tax-efficient way to purchase stocks.
Figure 1: Household Stock Ownership
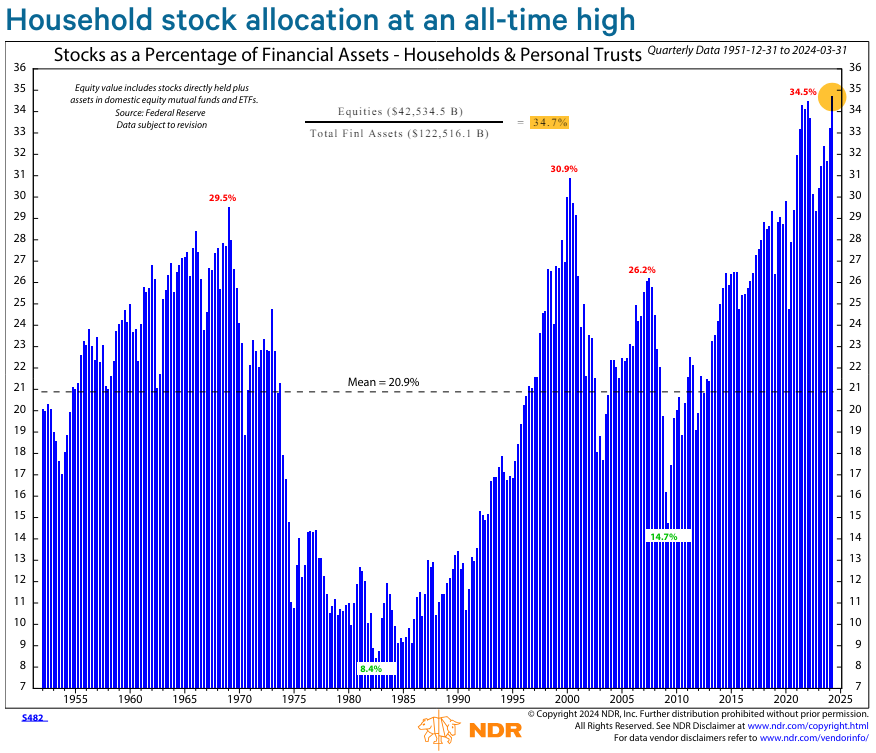
Source: Ned Davis Research
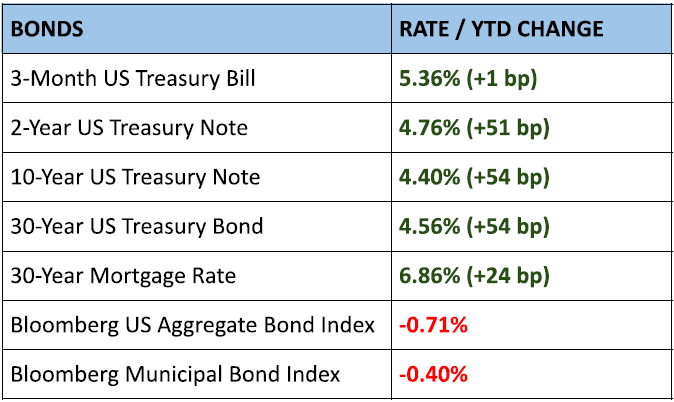
The US aggregate bond index is down about 1% this year as yields have risen. Bond prices move inversely to interest rates. As interest rates rise, bond prices fall. The US Treasury yield curve remains inverted with yields higher on the front end. The figure below plots the 10-year US Treasury Note (4.4%) minus the federal funds rate (5.5%) from 1960 to today. The current inversion is deeper and longer than most in the past 40 years. The Federal Reserve is expected to lower policy rates soon, possibly once in 2024 by 0.25%. Beyond this, it’s hard to predict what will happen.
Figure 2: Yield Curve & Monetary Policy (10-yr minus Fed Funds)
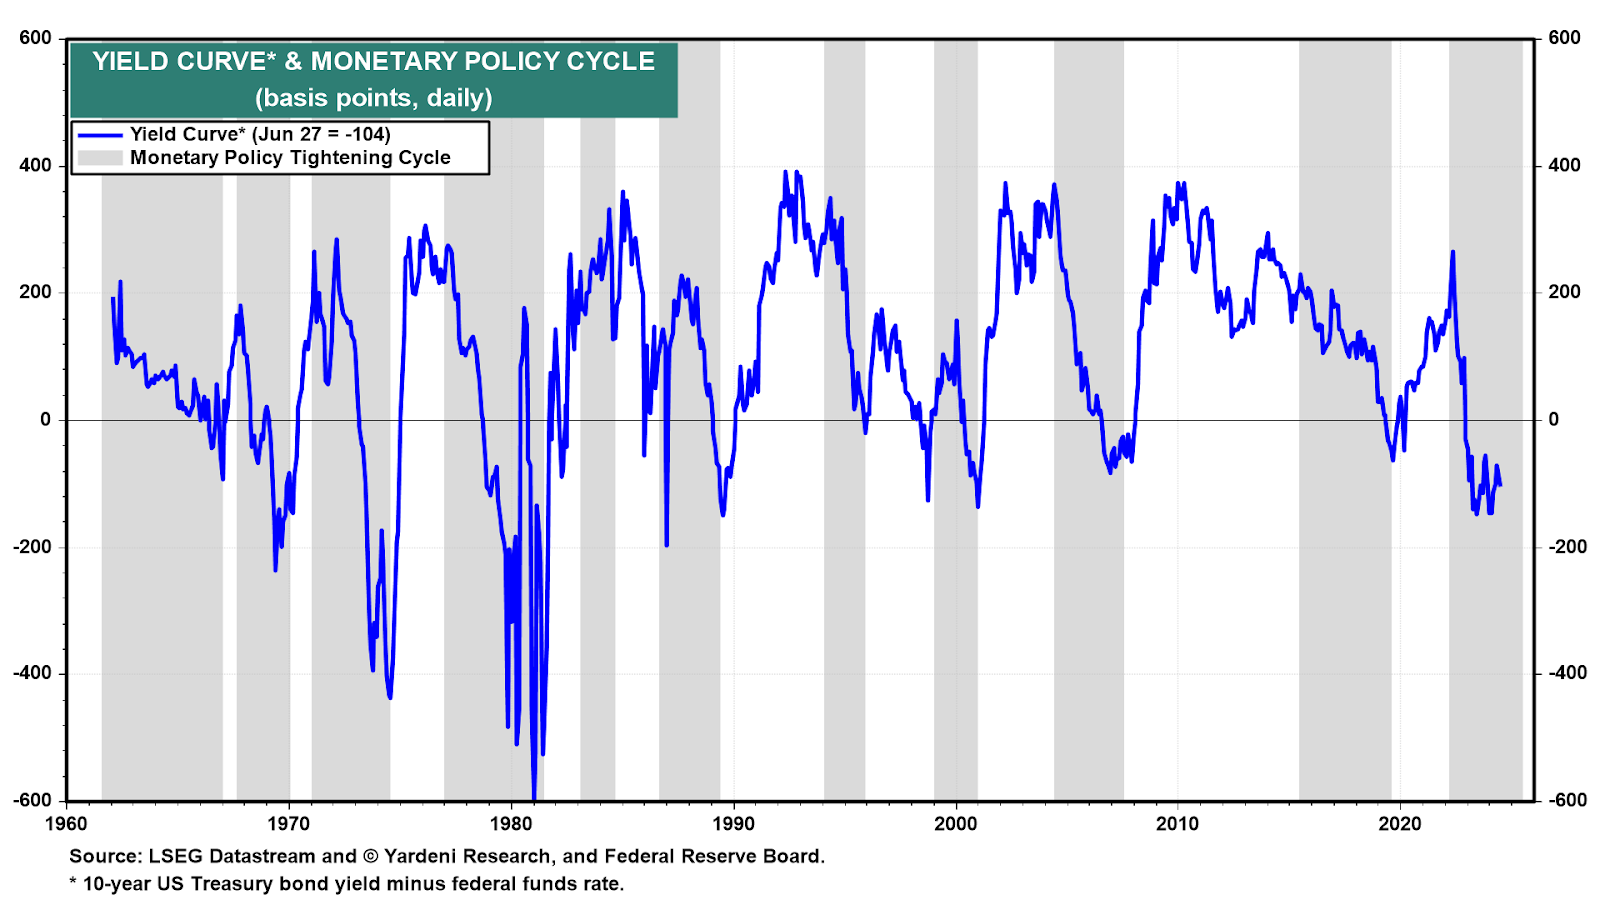
Source: Yardeni Research
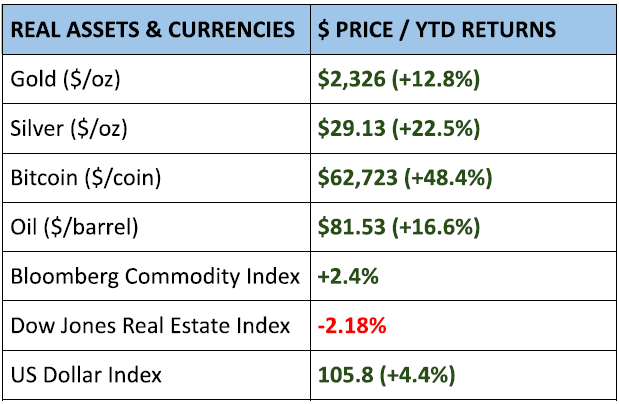
Commodities increased this year returning 2.4%. Silver ripped higher during the quarter finishing just below an important resistance level of $30 per ounce. The demand for physical silver is being driven from the East mostly for industrial uses, but also for uses as a monetary metal. The battle between the paper and the physical market added to volatility with some paper shorts being squeezed as prices increased. Gold also finished higher, up 13% as investors sought diversification from monetary inflation.
Figure 3: Silver
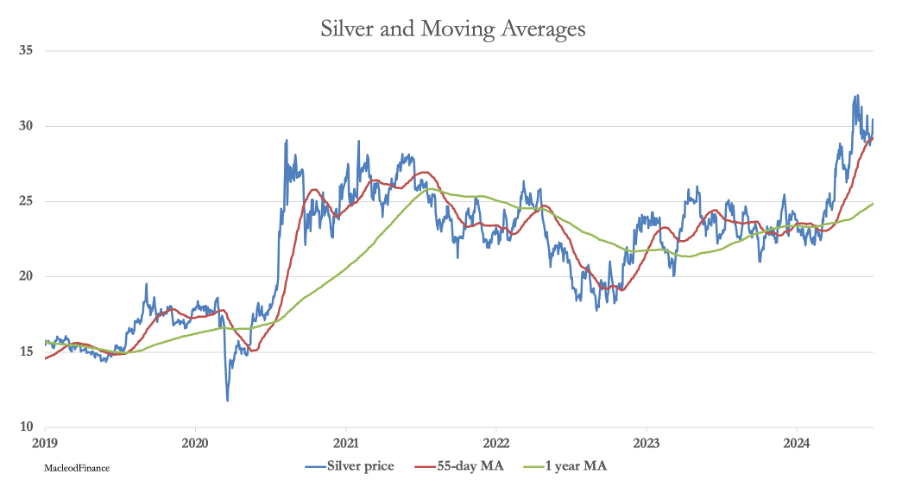
Source: Macleod Finance

US M2 money supply rose this year to $20.96 trillion. M2 consists of currency (dollars) in circulation in physical form or bank reserves, checking accounts, savings deposits, small-denomination time deposits (CDs), and money market funds. Essentially, short-term liquid cash either physical or digital. Consumer price inflation remains sticky at around 3.3%. US debt continues to rise hitting $34.67 trillion.
Figure 4: United States M2 Money Supply (1970 - 2024)
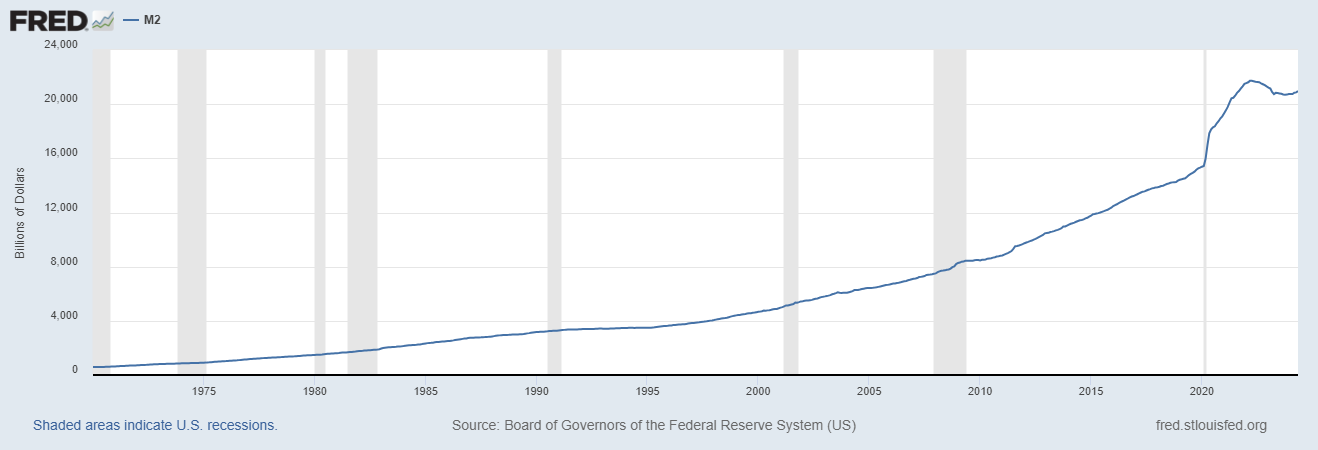
Source: Federal Reserve Bank of St. Louis (FRED) Economic Data
Quote of the Month
“Bubbles do not end like a short story, novel, or play. There is no final denouement that brings all the strands of a narrative into an impressive final conclusion. In the real world, we never know when the story is over.” - Robert Shiller
DISCLOSURES & INDEX DESCRIPTIONS