Quarterly Market Report - Q1 2025
Posted:January 7, 2025
Categories: 2025 Outlook, Asset Allocation, Bond Market, Bonds, Cash, Commentary, Economics, Federal Reserve, Gold, Inflation, Markets, Monetary Policy, Stock Market, US Dollar, US Treasuries
“Rationality is an a priori (theoretical) assumption about the way the world should work rather than a description of the way the world has actually worked” (Aliber et al., 2023)
We live in an uncertain world. Most investors usually behave rationally but sometimes irrationally, causing markets to dislocate on the upside or the downside. Market dislocations inherently occur in a “boom/bust” cycle in our current debt-based monetary system. Understanding cyclical (short-term) market trends and secular (long-term) trends enables a clearer view of the future in this crazy world in which we work and live. The investment business thrives on optimism, and for good reason. Market “booms” usually are much longer in duration than “busts.” A diversified portfolio of investments can provide offense and defense against inevitable irrational markets. With this in mind, let’s examine current economic data and liquidity measures and then turn to the financial markets.
ECONOMY & LIQUIDITY
Inflation
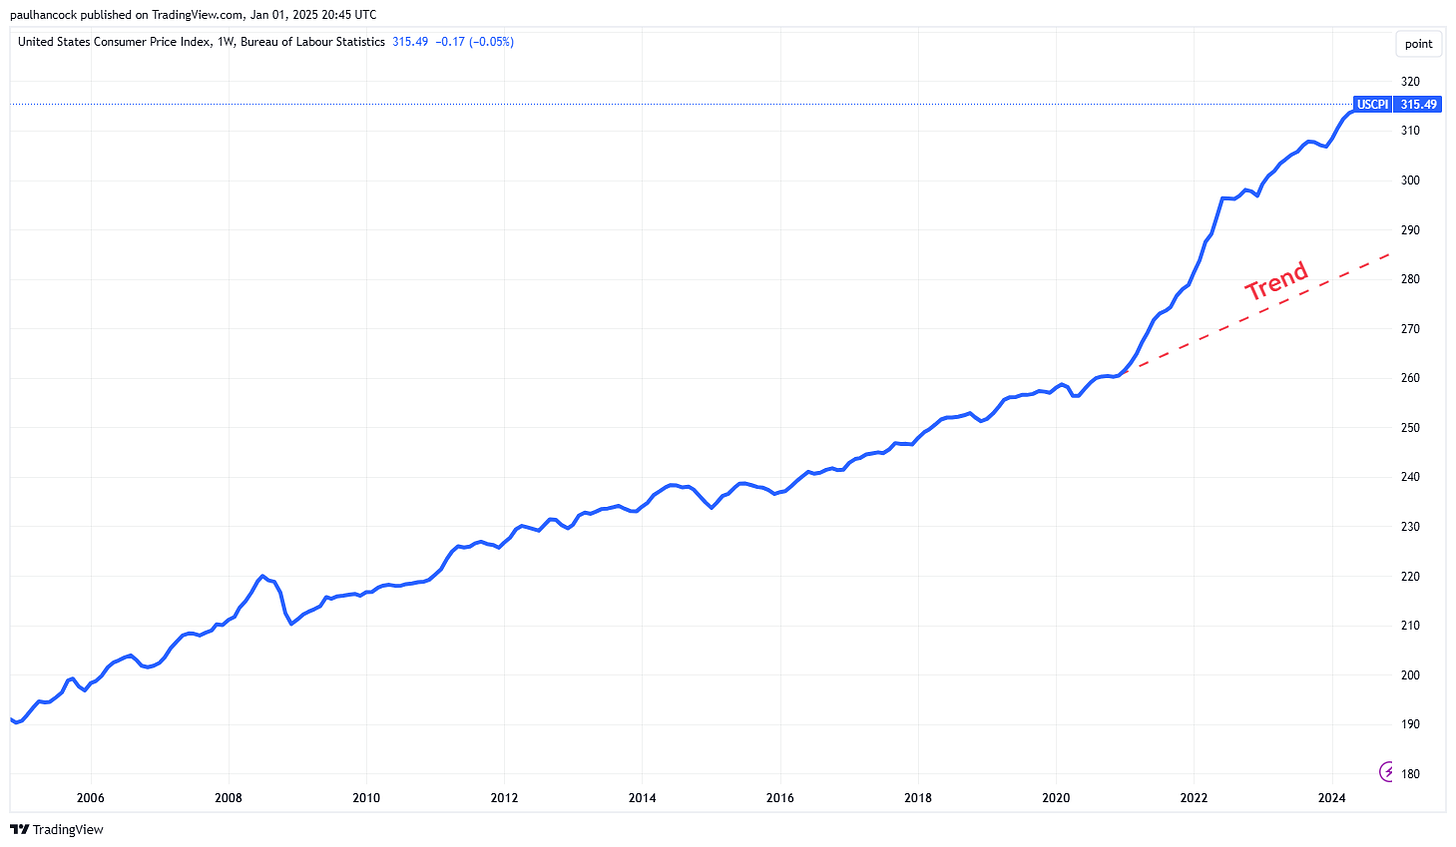
The annualized reported rate of consumer price inflation (CPI) remains sticky at around 2.7%, above the Federal Reserve target of 2%. The inflation rate is always reported at an annualized rate, which masks the long-term effects of inflation over time. Figure 1 below shows the US CPI for the past 20 years. The red dashed line approximates the inflation trend, which has increased noticeably since 2020. Inflation has risen by 71% since 2004, meaning a $1,000 grocery bill is now $1,700. For comparison, the median home sales price in the United States has grown from around $200,000 in 2004 to $420,000 in 2024, well above the inflation rate (Federal Reserve Bank of St. Louis).
Figure 1: US CPI Index - Last 20 years (as of November 2024)
Source: TradingView
Money Supply
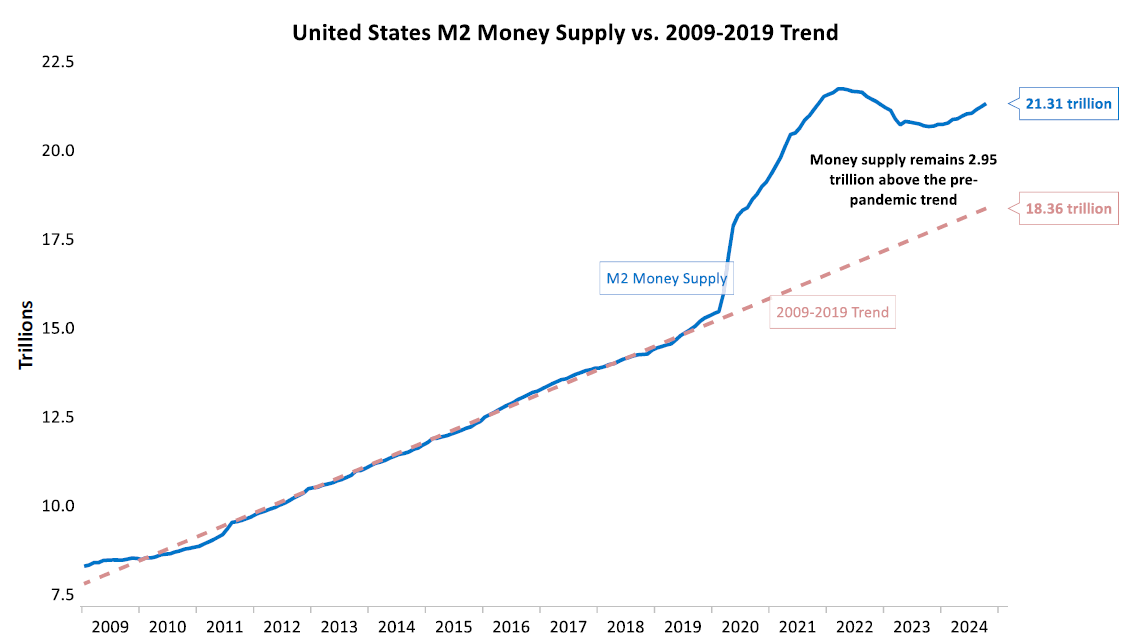
US M2 money supply rose this year to $21.5 trillion. M2 consists of currency (dollars) in circulation in physical or digital form, such as bank reserves (deposit accounts). See Figure 2 below from DoubleLine Capital. This chart shows how M2 has expanded dramatically since COVID-19, well above the trend line. This means a much higher supply of dollars is being pumped into the economy, contributing to inflation over the past few years.
Figure 2: US M2 Money Supply since 2009
Source: DoubleLine Capital
Global Liquidity
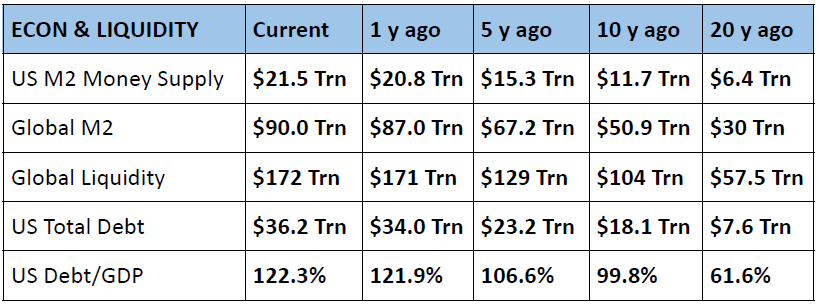
Global liquidity measures the growth of monetary inflation worldwide. It rose slightly this year to roughly $172 trillion, up from roughly $40 trillion in the early 2000s (Howell, 2020). This incredible trend in the growth of credit has fueled markets and, some would say, been a major contributor to an “everything bubble” from stocks to cryptocurrencies.
Global liquidity is a slippery term. Think of global liquidity as the movement of short-term cash and credit worldwide, from individuals to banks, central banks, shadow banks, corporations, etc. The specific definition is defined in the book Capital Wars as:
“a source of funding that measures the gross flows of credit and international capital feeding through the world’s banking systems and collateral-based wholesale money markets. It is determined by the balance sheet capacity of all credit providers and represents the private sector’s ability to access cash through savings and credit.” (Howell, 2020).
Howell shows that global liquidity has a 5-6-year cycle from trough to trough. Periods of rising global liquidity coincide with rising stock markets. We are roughly halfway through the current liquidity cycle, and with two great years of stock market returns, much of the easy money has been made. Understanding the cycle of global credit and monetary flows, along with central bank activities and currency fluctuations, is important for investors as they assess how to rebalance portfolios.
Below is a table of various economic and liquidity measures. Notice the rise in consistent debt, credit, and general monetary inflation.
STOCK MARKETS
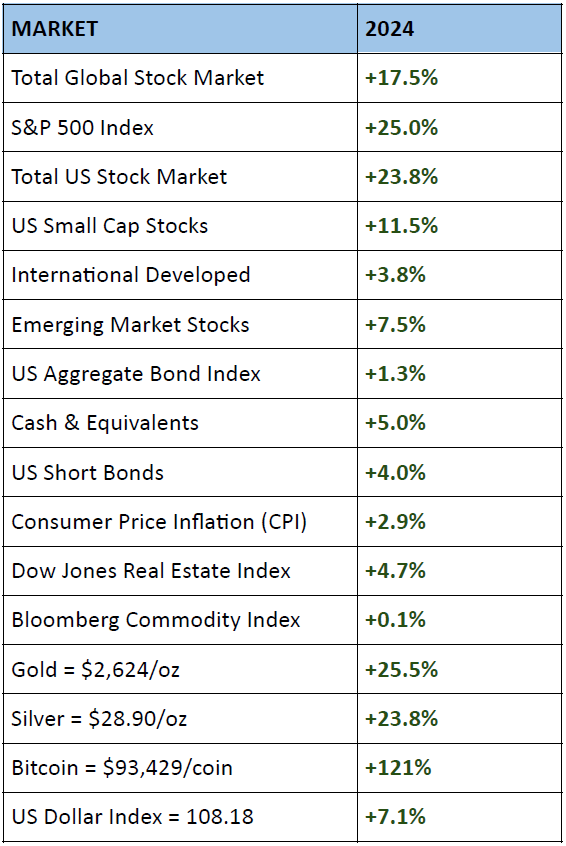
Stocks rose sharply again in 2024, with the S&P 500 returning 25% after rising 26% in 2023. This doesn’t mean stocks can’t continue to go higher. However, the market has run tremendously since 2009, with the S&P 500 rising 14 years out of the past 16. It’s clear now that the tremendous amount of monetary inflation worldwide has skewed stock market valuations. Much of the liquidity created by central, commercial, and shadow banks has reached the United States stock markets.
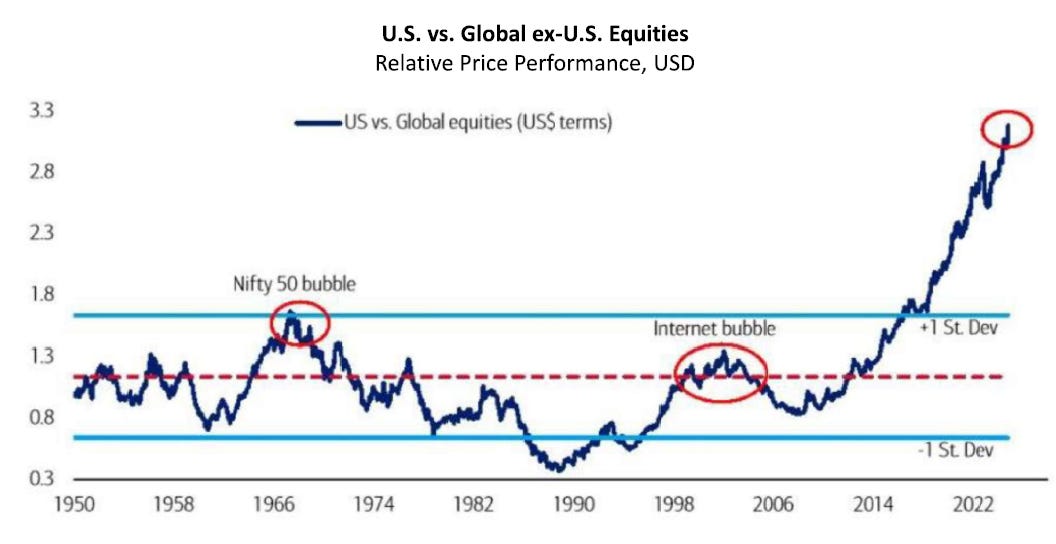
Figure 3 below shows the historical divergence between US stocks and global stocks. US stocks have become unhinged from the rest of the world, leading some market participants to abandon international investing. This is a mistake. While I still view US stocks as attractive, it would be unwise to concentrate 100% of equity exposure in one country.
Figure 3: US Stocks vs. Global Stocks
Source: DoubleLine Capital
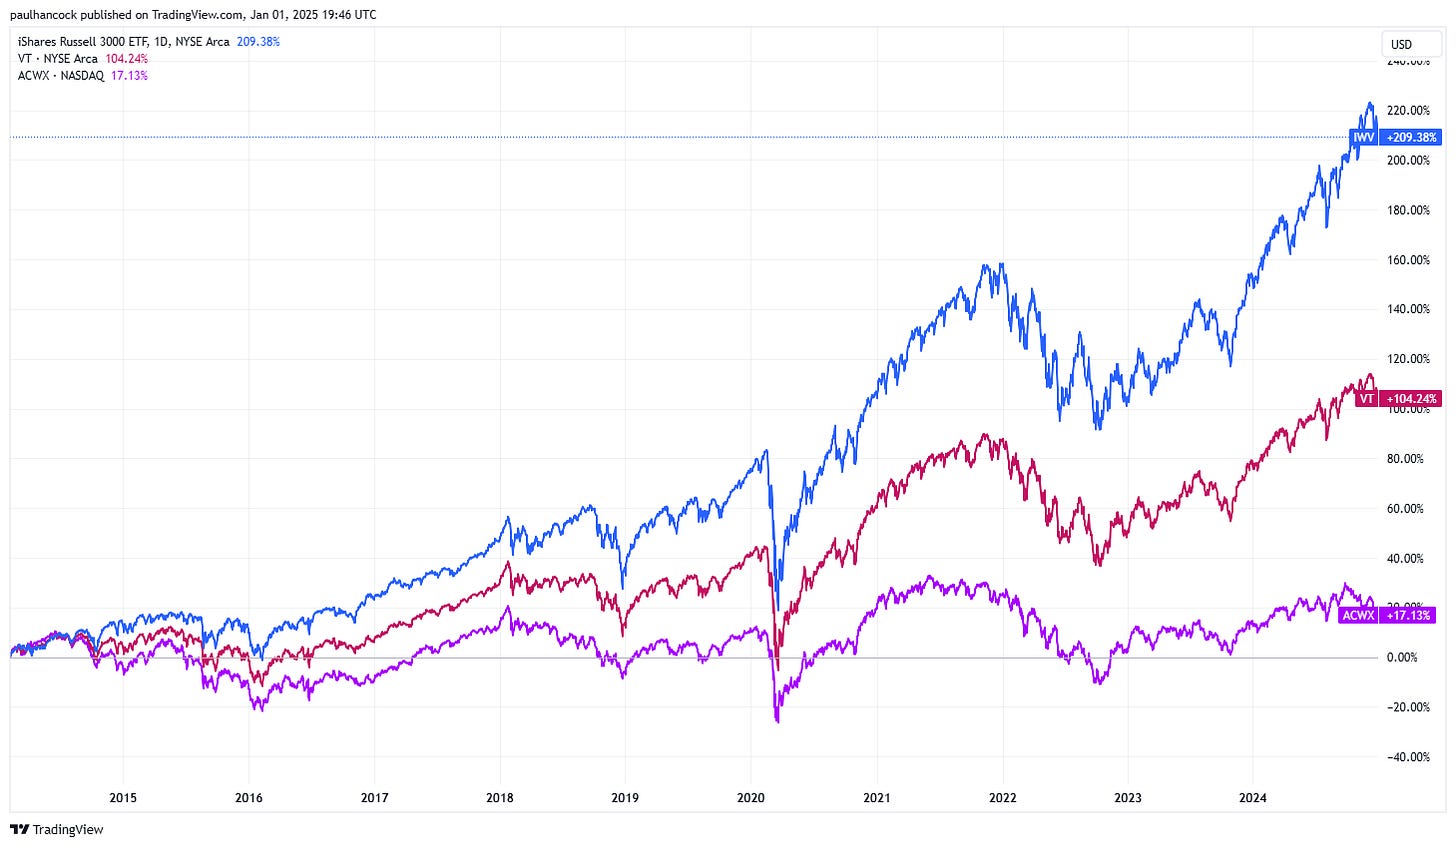
Figure 4 below shows returns for US stocks (blue), international stocks (purple), and an index of US and non-US stocks representing the “Global Stock Market” (red). While it “feels” good to be the blue line, strong returns relative to other markets won’t last forever. Remember that US stocks comprise over 70% of the global stock index.
Figure 4: 10-Year Returns - US Stocks / Total World Stock Index / World Stocks ex-US
Source: TradingView
BOND MARKETS
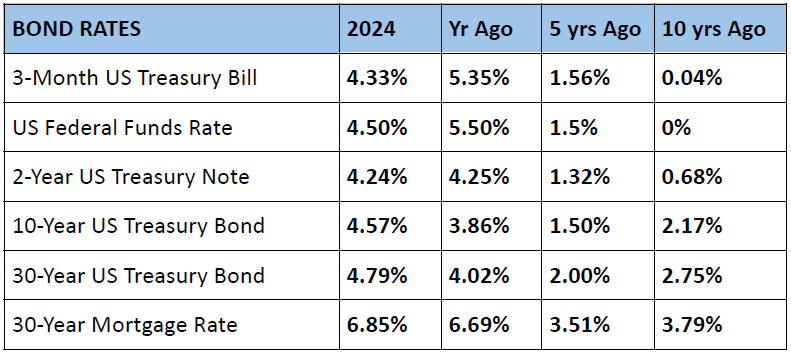
Bonds edged higher in 2024, with the benchmark aggregate bond index returning 1.3%. Cash and short-term bonds led the way in the higher quality parts of the market, while high-yield corporate bonds also faired well. Short-term US treasury rates went from roughly 5.3% to 4.3%, consistent with the Federal Reserve lowering short-term rates. Long-term bonds, such as the 10-year and 30-year US Treasury, moved higher, causing prices to decline. Cash and short-term bonds continue to look attractive relative to historical rates. Adding duration may also benefit bond portfolios depending on quality and place along the yield curve.
The interest rates between the US Treasury and corporate bonds are as close as ever. The market coined the term “credit spreads.” While some would caution that this is a bearish signal, it might signal a very healthy corporate sector in the United States. Many companies are flush with cash and have termed out their long-term liabilities. Potential positivity out of Washington will only bolster large US companies.
Federal Reserve Policy
More volatility is on the horizon for 2025 concerning Federal Reserve policy. Like in 2022, the Federal Reserve enters the year in a hawkish (restrictive) mood regarding interest rates, with the market now pricing fewer interest rate cuts. The most recent Fed meeting inserted uncertainty into markets regarding future Fed policy; will we see a dovish (accommodative) or hawkish (restrictive) Fed in 2025? This adds to the uncertainty. The Fed Funds rate closely follows the 2-year US Treasury rate. The 2-year US Treasury ended the year at 4.33%, close to the target Federal Funds rate. This current trend signals fewer rate cuts on the horizon for 2025. However, markets can get this wrong. I would not rule out more rate cuts as the Fed is anxious to decrease funding costs for the US Treasury. The government has roughly 30% of its debt to roll over in the next few years. That equates to about $8.5 trillion in debt maturing at rates near 2.5%, rolled over to fresh bonds at rates between 4% and 5%.
REAL ASSETS & CURRENCY MARKETS
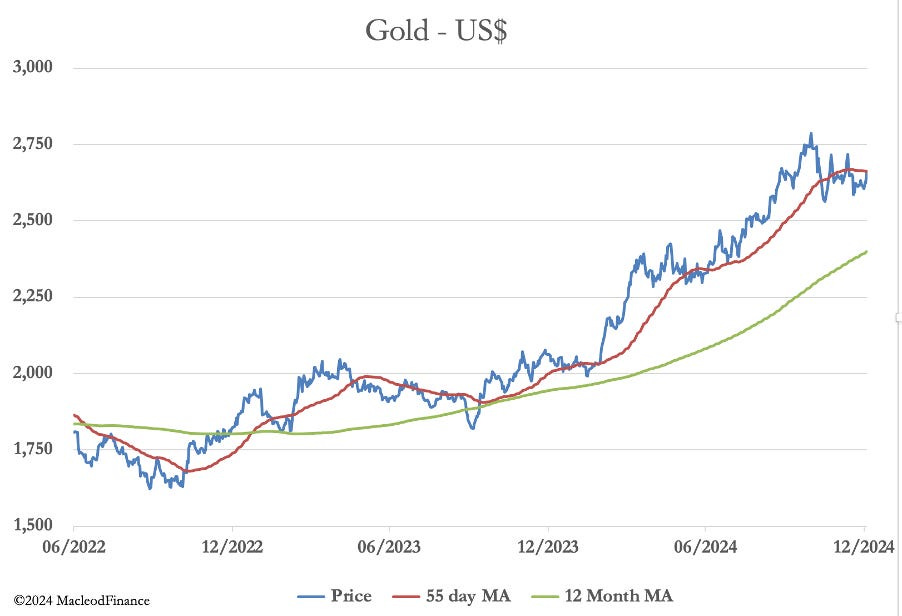
Gold had another tremendous year, returning 25.5% on the year. The yellow metal has compounded returns at 8% over the past 10 years. Gold prices in most currencies soared, signaling global debasement worldwide. As I’ve reported before, central banks have been massive buyers of gold as a part of their reserve strategies. Many gold buyers are also moving capital to diversify away from the fiscal woes we face in the United States and the global economy. Historically, a 25% yearly return is an outlier. However, the technical chart (see below) and the fundamentals look good. Silver also fared well, ending up 24%. Oil was a laggard, dragging down the commodities index, which was flat this year.
Figure 5: Gold
Source: Macleod Finance
US Dollar
The story since the election is the strength of the US Dollar. A strong dollar has massive ripple effects on the global economy. A strong dollar hurts other countries, as many countries have a trade surplus with the United States. Foreign currencies decline relative to the dollar, forcing those with dollar-denominated debt to sell assets. The US dollar appears to be peaking short-term and is hitting key resistance levels. Therefore, I wouldn’t be surprised to see near-term weakness in the dollar and a drop in interest rates as we move into 2025. A near-term consolidation in the US dollar index will also help to push down US Treasury yields. A strong dollar typically coincides with stronger long-term bond yields, such as the 10-year US Treasury.
Sources: Kwanti Portfolio Analytics, TradingView
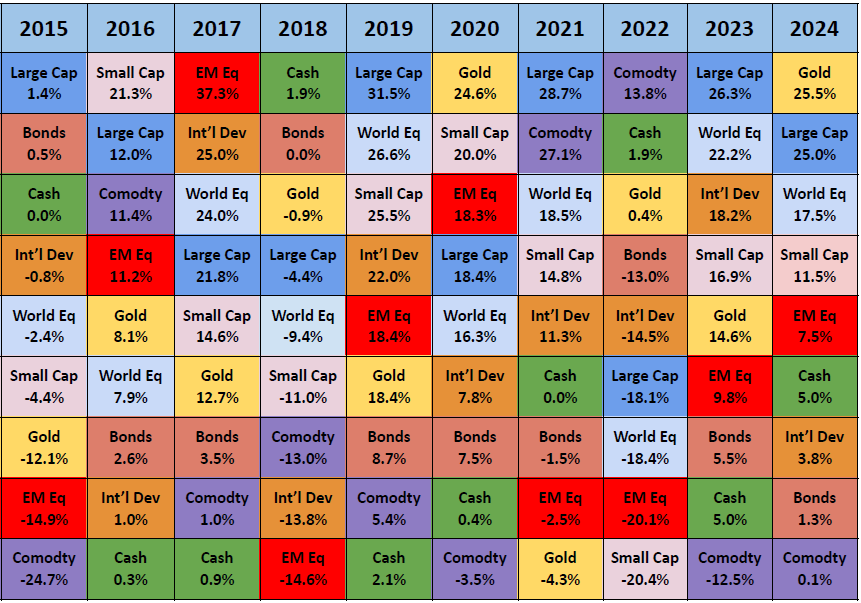
HISTORICAL MARKET RETURNS - YEAR BY YEAR
Quote of the Month
"The wonderful thing about financial markets is that we keep on stepping on the same rake. In science, progress is cumulative. You stand on the shoulders of giants, but financial history is invariably cyclical and recurrent, which helps a lot if you can recognize patterns." Jim Grant
References
- Aliber, R., Kindleberger, C., & McCauley, R. (2023). Manias, Panics, and Crashes (8th ed.). Palgrave Mcmillan.
- Federal Reserve Bank of St. Louis. (n.d.). Median Sales Price of Houses Sold for the United States [Dataset]. https://fred.stlouisfed.org/series/MSPUS
- Howell, M. (2020). Capital Wars: The Rise of Global Liquidity (2020th ed., Vol. 1). Springer.
- World - M2 Money Supply of Major Central Banks. (2024). [Dataset]. MacroMicro. https://en.macromicro.me/charts/3439/major-bank-m2-comparsion
- Public debt of the United States. (2024). [Dataset]. Statista. https://www.statista.com/statistics/273294/public-debt-of-the-united-states-by-month/
- TradingView
- Kwanti, Inc.
- Morningstar, Inc.
- CrossBorder Capital
- DoubleLine Capital
- J.P. Morgan Asset Management
DISCLOSURES & INDEX DESCRIPTIONS
For disclosures and index definitions, please click here.
Unless otherwise specifically cited, opinions expressed herein are solely those of Genesis Wealth Planning, LLC. The material presented is believed to be from reliable sources, and our firm makes no representations regarding other parties’ informational accuracy or completeness. Written content is for information purposes only. Past performance is no guarantee of future results. Diversification does not assure profit or protect against a loss in a declining market. While we have gathered this information from sources believed to be reliable, we cannot guarantee the accuracy of the information provided. The views, opinions, and forecasts expressed in this commentary are as of the date indicated, are subject to change at any time, are not a guarantee of future results, do not represent or offer any particular security, strategy, or investment, and should not be considered investment advice. Investors should consider the investment objectives, risks, and expenses of a mutual fund or exchange-traded fund before investing. Furthermore, the investor should independently assess the legal, regulatory, tax, credit, and accounting and determine, together with their professional advisers, if any of the investments mentioned herein are suitable to their personal goals. All indexes are unmanaged and an individual cannot invest directly in an index. Index returns do not reflect fees or expenses. Please contact us to receive a copy of Genesis Wealth Planning ADV Part II, which contains additional disclosures, proxy voting policies, and privacy policy. Certified Financial Planner Board of Standards Inc. owns the certification marks CFP®, CERTIFIED FINANCIAL PLANNER™ and federally registered in the U.S., which it awards to individuals who successfully complete CFP Board's initial and ongoing certification requirements.
Asset Allocation Quilt Sources: Bloomberg, Kwanti, MSCI, Russell. Large Cap: S&P 500 Index TR, Small Cap: Russell 2000 Index TR, World Equity: MSCI All Country World Index TR, International Developed: MSCI EAFE Index TR, Emerging Markets: MSCI Emerging Markets Index TR, Bonds: Bloomberg US Aggregate Bond Index, Cash: US Treasury Bill 90 Days Rate, Gold: Gold Spot, Commodities: Bloomberg Commodity Index. All data represent returns for the stated period. Unlike the results in an actual performance record, these results do not represent actual trading. Also, because these trades have not been executed, these results may have under or over-compensated for the impact, if any, of certain market factors, such as lack of liquidity. In general, simulated or hypothetical trading programs are also subject to the fact that they are designed with the benefit of hindsight. No representation is made that any account will likely achieve profits or losses similar to those shown.

