Global Credit Outlook - Q3 2024
Posted:July 25, 2024
Categories: Bond Market, Bonds, Central Bank, Currencies, Government Bond Yields, Interest Rates, Gold
The focus of this article is on the credit, bond, and currency markets. The stock markets tend to get the lion’s share of attention and rightly so. However, investors must also pay careful attention to the bond market.
US Treasury Market
The government bond market is an important indicator of the global economy. This market is where the price of money and credit is set. US Treasuries underpin the base monetary system and back the US dollar. Below are current rates for various maturities of debt.
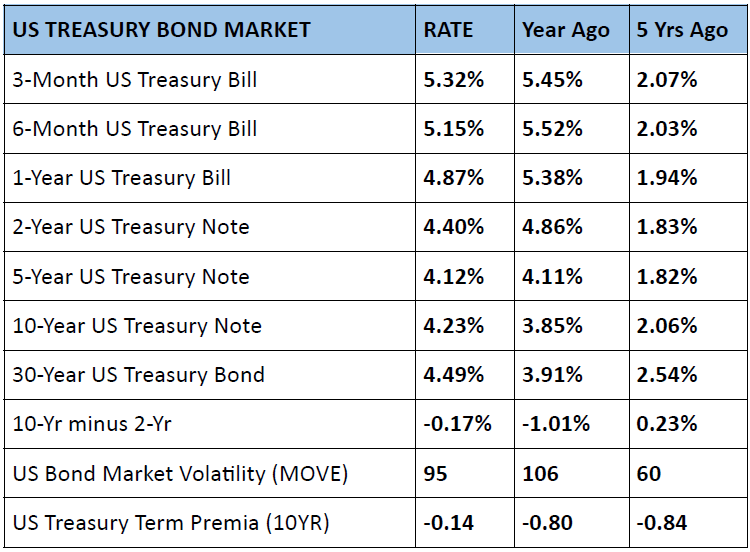
The “yield curve” thus is built off of these various rates. Normally, the yield curve has an “upward slope”.
For example, say you are lending money to a neighbor. If you lend money for one week, you have a high degree of certainty of getting your money back due to the short time frame. Thus, you would charge a lower rate, say 3%. However, if you were to lend the same amount for 5 years, you are taking a bigger risk. Thus, you demand a higher interest rate, say 6%. This creates an upward-sloping yield curve.
At present, the yield curve is currently “inverted,” meaning it has a negative slope. Interest rates are higher on the short end vs. further out the yield curve. See figure 1 below. This is due to the Federal Reserve raising short-term interest rates starting in 2022 as they attempted to slow down inflation and the economy.
Figure 1: US Treasury Yield Curve (as of 7/24/2024)
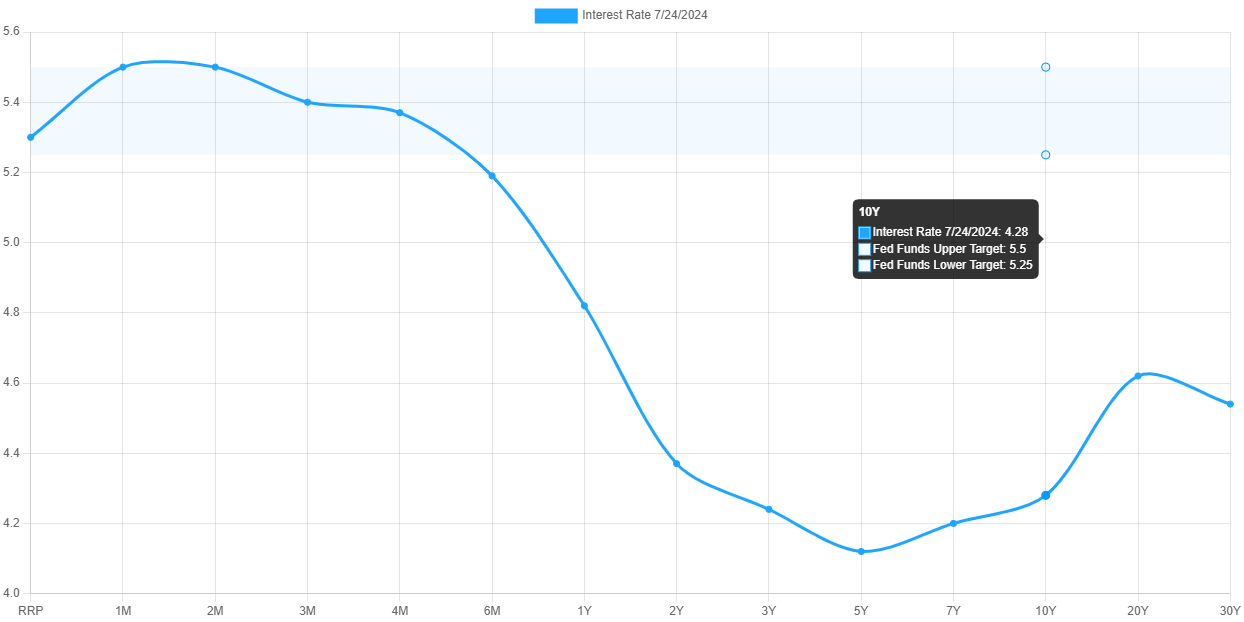
Source: ustreasuryyieldcurve.com
However, the curve has started now to “dis-invert”, see Figure 2 below charting the 10-year treasury minus the 2-year treasury. Historically, this is a classic recession indicator. This is also an indication of the market starting to price in interest rate cuts by the Federal Reserve.
Figure 2: US 10Y-2Y

Source: x.com/GameofTrades
With Treasury bills above 5% for now, this part of the market is attractive. Treasury bills are “money-like” investments with maturities of one year or less. Since 1900, the average long-run nominal yield on T-Bills is 3.5% (0.5% yield + 3% inflation). The 2-year and 5-year rates also remain attractive for bond investors willing to lock in rates and take a small interest rate risk.
A recent paper published this week by Nouriel Roubini argues that the US Treasury’s issuance of debt in the last couple of years has suppressed the 10-year treasury by roughly 0.50%. They’ve accomplished this by increasing the number of T-Bills (“money-like”) issued relative to coupon debt (longer in duration). This action reduces the supply of longer-term debt thus increasing prices and reducing yields. This squares with the analysis I’ve written about in the past concerning “Fiscal Dominance”. The bottom line is that the middle to long end of the curve will remain volatile.
Global Bond Markets
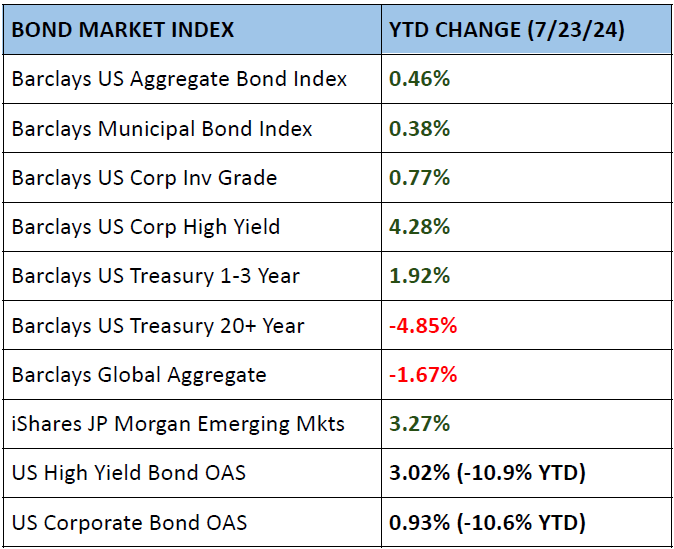
The US Aggregate Bond Market is flat this year returning 0.46%. High-grade corporate and municipal bonds are showing similar returns. Short-term debt and riskier areas of the market such as high yield and emerging market debt have faired better this year. The interest rate spread (“OAS”) between high-yield debt and US Treasuries fell. When this occurs, less financially stable companies find it easier to refinance current obligations or issue new debt. Falling spreads are common during equity bull markets. However, the tighter this spread becomes, the more likely financial conditions are too loose and potentially poised to reverse.
All eyes are on the US Federal Reserve as they meet next week. The Fed is poised to lower interest rates possibly in September, but a rate cut next week is not out of the question.
Gold vs. Paper Currencies
Gold is seen by many as “world money”. Most central banks hold gold as a portion of their savings known as “reserves”. Spot gold has risen 16% vs. the US dollar this year as investors look to guard against falling currencies. Gold sits right around $2,400 per troy ounce in trading. The price of gold is simply the inverse of the dollar. In other words, when gold is rising, it’s also the dollar dropping. Looking across the world, all major currencies have been debased vs. gold over the past 5+ years.
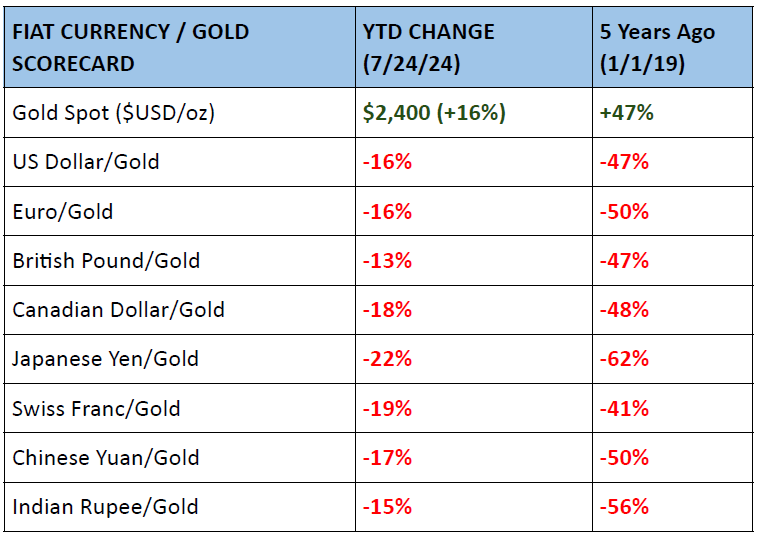
Figure 3: Gold YTD (US$ / OZ)

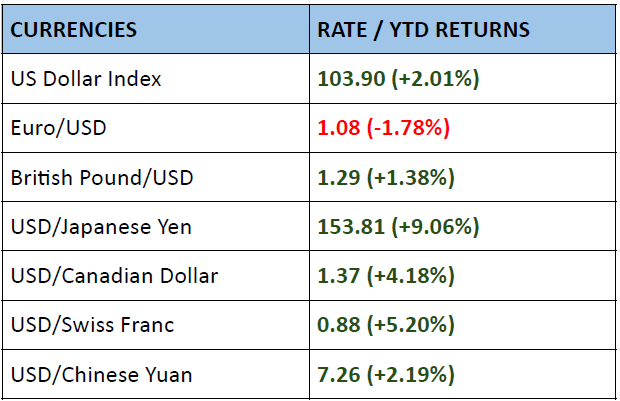
Bond Market Rates & Currency Pairs

References
- global-investment-returns-yearbook. (2024, March 6). Investment Bank. https://www.ubs.com/global/en/investment-bank/in-focus/2024/global-investment-returns-yearbook.html
- Federal Reserve Bank of New York: Federal Reserve Board
- Roubini, N., & Miran, S. (n.d.). ATI: Activist Treasury Issuance and the Tug-of-War Over Monetary Policy. Hudson Bay Capital.
- fxtop.com
DISCLOSURES & INDEX DESCRIPTIONS